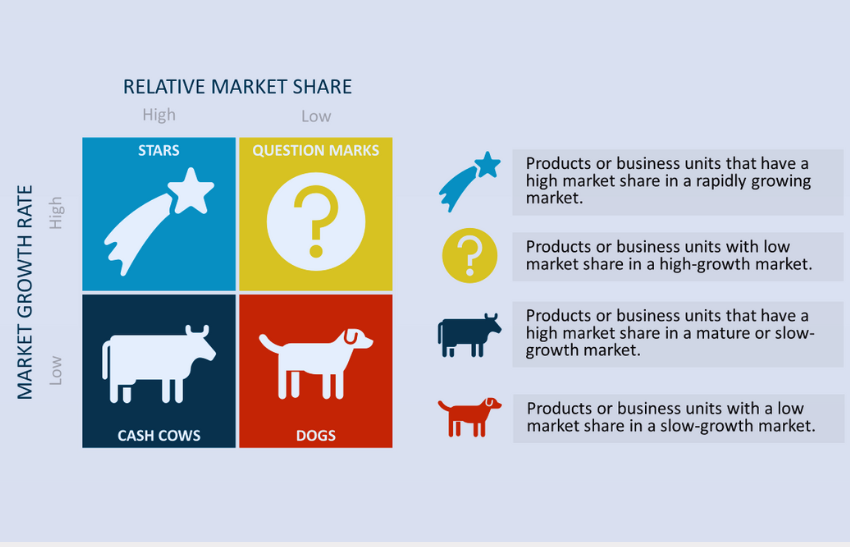
The BCG Growth-Share Matrix, also known as the Boston Consulting Group (BCG) Matrix, is a strategic management tool that helps businesses analyse and classify their product or service portfolio based on two key dimensions: market growth rate and relative market share. It was developed by Bruce D. Henderson, the founder of the Boston Consulting Group, in the early 1970s.
The matrix is divided into four quadrants, each representing a different strategic category for products or business units:
-
Stars (High Market Share, High Growth Rate):
- Stars are products or business units that have a high market share in a rapidly growing market.
- They require substantial investments to sustain their growth and market leadership.
- Over time, successful stars may evolve into cash cows as the market growth rate slows down.
Example: A technology company that has recently launched a cutting-edge smartphone with innovative features, capturing a significant market share in the rapidly growing smartphone market. The company will be investing heavily in marketing and research to maintain its competitive edge.
-
Cash Cows (High Market Share, Low Growth Rate):
- Cash cows are products or business units that have a high market share in a mature or slow-growth market.
- They generate significant cash flows but require relatively low investments.
- These businesses are typically considered stable and can be a source of funds to support other parts of the portfolio.
Example: An established beverage company that holds a dominant market share in the mature soft drink industry. The product line may include well-known and widely consumed beverages that continue to generate consistent and substantial profits. The company will need to focus on efficient production and distribution with minimal additional investments.
-
Question Marks (Low Market Share, High Growth Rate):
- Question marks, also known as problem children or wildcats, have a low market share in a high-growth market.
- They require careful consideration and investment decisions as they have the potential to become stars or may be discontinued if they do not gain market share.
- Strategic decisions involve either investing to increase market share or phasing out the product/business.
Example: A start-up in the electric vehicle industry that has developed a promising new electric scooter. While the market for electric vehicles is growing rapidly, the company has a relatively low market share. It will require further investment to expand production and marketing efforts to compete with established players.
-
-
Dogs (Low Market Share, Low Growth Rate):
-
- Dogs are products or business units with a low market share in a slow-growth market.
- They do not have strong growth prospects and may not generate substantial cash flows.
- Businesses must decide whether to divest or maintain these products/business units based on their overall strategic fit.
Example: An outdated software product from a software development company has a low market share in a market with limited growth. The company recognizes that the product is becoming obsolete, and it may consider phasing it out or selling it while focusing on more promising opportunities.
The BCG Growth-Share Matrix provides a visual representation that helps organizations allocate resources, prioritize investment decisions, and develop appropriate strategies for each product or business unit within their portfolio. It’s important to note that the matrix has its limitations, and businesses should consider other factors beyond market share and growth rate when making strategic decisions.
WATCH THE VIDEO HERE
Using The BCG Growth-share Matrix for Strategic Decisions.
Using the BCG Growth-Share Matrix for strategic decision-making involves assessing and categorising a company’s product or business unit portfolio based on their market growth rate and relative market share. The following steps outline how the model can be employed:

- Portfolio Analysis:
- Identify and list all the products or business units in your portfolio.
- Determine the market growth rate for each product or business unit. This involves assessing the growth potential of the market in which each operates.
- Calculate Relative Market Share:
- Determine the relative market share for each product or business unit. This can be calculated by dividing the product’s market share by the market share of the largest competitor in the same market.
- Plotting on the Matrix:
- Place each product or business unit on the BCG Matrix based on its market growth rate and relative market share. This categorization will result in the products/business units falling into one of the four quadrants: Stars, Cash Cows, Question Marks, or Dogs.
- Strategic Implications for Each Quadrant:
- Stars: Allocate resources to maintain and enhance their market position. Consider strategic investments for further growth.
- Cash Cows: Continue to generate cash flow and consider reinvesting in high-potential areas or returning profits to shareholders.
- Question Marks: Decide whether to invest further to turn them into stars or consider divestment if they are unlikely to achieve significant market share.
- Dogs: Evaluate options such as divestment, phasing out, or repositioning. Focus on minimizing resource allocation to low-potential areas.
- Adjust Strategy Accordingly:
- Based on the analysis, develop, and adjust strategic plans for each product or business unit. This may involve resource allocation, investment decisions, marketing strategies, or product development initiatives.
- Regular Review and Adaptation:
- Markets and products evolve, so it’s essential to regularly review and update the BCG Matrix. Products may move between quadrants over time, requiring adjustments to the strategic focus and resource allocation.
- Consider External Factors:
- While the BCG Matrix is a valuable tool, it’s important to consider external factors such as industry trends, competitive forces, and market dynamics that may influence strategic decisions beyond the matrix analysis.
Final Remark
By applying the BCG Growth-Share Matrix, organizations can gain insights into their portfolio’s strategic position and make informed decisions to optimize resource allocation, maximize profitability, and ensure long-term competitiveness. However, it’s crucial to use the model in conjunction with other strategic tools and consider the specific context of the organization and industry.
References
Henderson, B. D. (1970). “The Product Portfolio.” In Perspectives on Experience (pp. 127-142). Boston, MA: Boston Consulting Group.
Dess, G., Lumpkin, G. T., Eisner, A. B., & McNamara, G. (2018). Strategic Management: Text and Cases. McGraw-Hill Education.